
The image above was created using AI. More specifically, this was the first image generated by Dall-E 3, when given the prompt “Grading Robots’ Reading Abilities”.
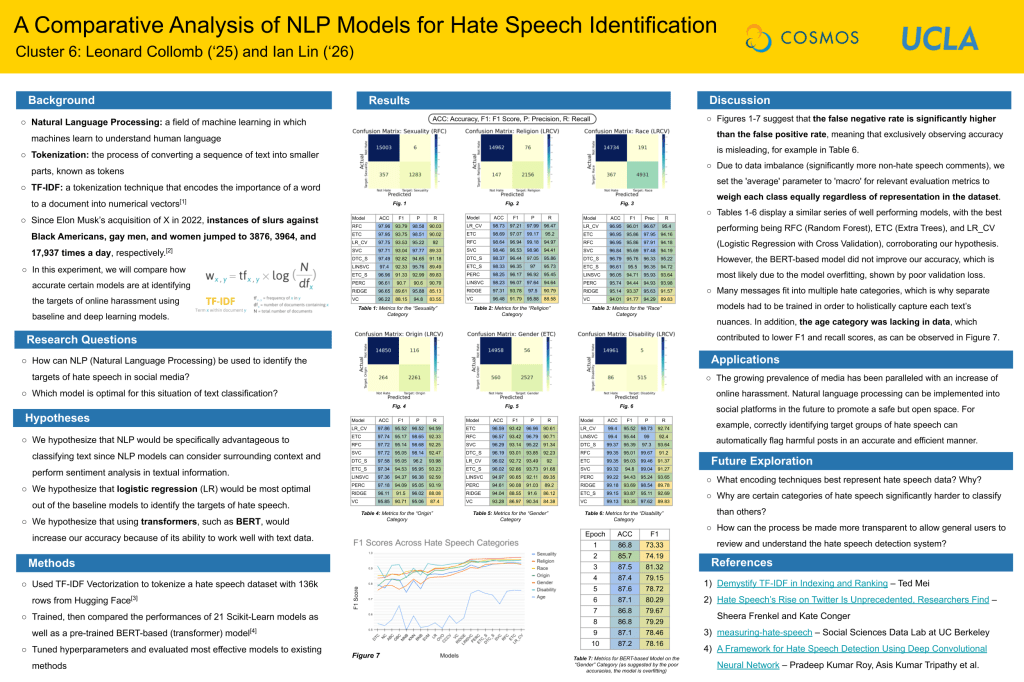
In our previous posts, we laid the groundwork for classifying hate speech based on the identifiers it targets. In the first part, we outlined the goals and focused on data preprocessing. Then, in Part 2, we explored various models, discussing their key attributes and reasons for selection.
Now, in this final post, we’ll walk through the evaluation process for the models and analyze the results. Model evaluation is a critical phase where we measure how well our models generalize to unseen data and choose the best-performing one for this classification task.
Evaluation Strategy
Before jumping into the code, let’s briefly explain how we will evaluate our models. We’ll use these key metrics:
- Accuracy: The percentage of correct predictions.
- Precision: Measures how well the model avoids false positives.
- Recall: Measures how well the model avoids false negatives.
- F1-Score: The harmonic mean of precision and recall, balancing both.
Furthermore, we will be comparing Confusion Matrices for our best performing classifiers in order to gain somewhat of an understanding of why they are so effective. These metrics will give us a comprehensive picture of how each model performs, especially since we are working with an imbalanced dataset.
Model Evaluation
First, we define a function that will help us evaluate each model. This function will output the accuracy, classification report, and confusion matrix for a given model:
from sklearn import metrics

def prediction(model, X_train, X_test, y_train, y_test):
    model.fit(X_train, y_train)
    pr = model.predict(X_test)
    acc_score = metrics.accuracy_score(y_test, pr)
    f1 = metrics.f1_score(y_test, pr, average='macro')
    precision = metrics.precision_score(y_test, pr, average='macro')
    recall = metrics.recall_score(y_test, pr, average='macro')
    return acc_score, f1, precision, recall
The prediction function fits the model using the training data and then generates predictions (pr) on the test data; it calculates four key metrics: accuracy, F1 score, precision, and recall. Now, we will use this function to evaluate several classifiers. We’ll store the classifiers in a dictionary and loop through them, calculating their evaluation metrics:
clfs = {
    'LR': lg,
    'MNB': mnb,
    'DTC': dtc,
    'KNN': knn,
    'RFC': rfc,
    'ETC': etc,
    'ABC': abc,
    'GBC': gbc,
    'ETC_SINGLE': etc_single,
    'DTC_SINGLE': dtc_single,
    'OCC': occ,
    'OVO': ovo,
    'OVR': ovr,
    'RIDGE': ridge,
    'VC': vc,
    'BNB': bnb,
    'CCCV': cccv,
    'LINSVC': linsvc,
    'LOGREG_CV': logreg_cv,
    'NC': nc,
    'PERC': perc,
    'SVM': sv,
    'SVC': svc
}

# Dictionaries to hold scores
acc_scores = {}
f1_scores = {}
precision_scores = {}
recall_scores = {}

# Assuming X_train_tfidf, X_test_tfidf, y_train, y_test are defined
# Loop through each classifier, make predictions, and calculate scores
for name, clf in clfs.items():
    acc_scores[name], f1_scores[name], precision_scores[name], recall_scores[name] = prediction(clf, X_train_tfidf, X_test_tfidf, y_train, y_test)
    print(f"{name}: Accuracy={acc_scores[name]}, F1 Score={f1_scores[name]}, Precision={precision_scores[name]}, Recall={recall_scores[name]}")
Using a loop, we applied the prediction function to each classifier, storing the metrics in separate dictionaries for accuracy, F1 score, precision, and recall. This gives us an immediate snapshot of how each model performs across different evaluation measures (you can find the results we got from our poster, which is displayed below).
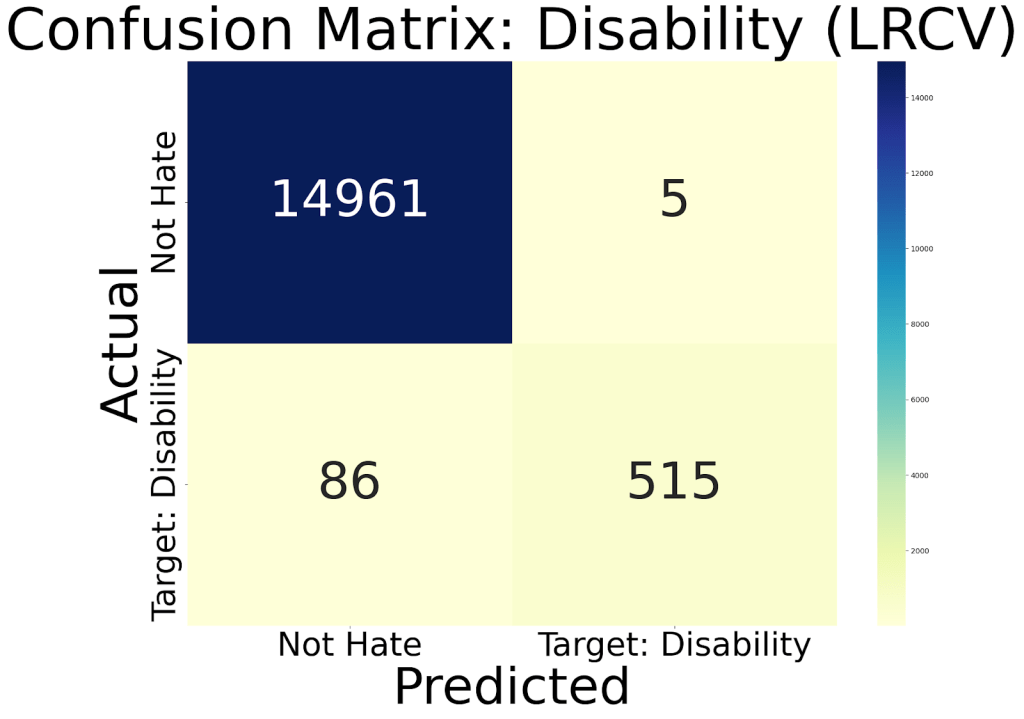
Next, we’ll visualize the performance of our best model using a confusion matrix. For this example, we’ll focus on Logistic Regression with Cross-Validation (logreg_cv).
from sklearn.metrics import confusion_matrix
import seaborn as sn
import matplotlib.pyplot as plt
import pandas as pd

y_pred = logreg_cv.predict(X_test_tfidf)
cm = confusion_matrix(y_test, y_pred)

# Create a DataFrame for the confusion matrix
confusion_matrix = pd.DataFrame(cm, index = [i for i in ["Not Hate", "Target: Disability"]],
                                columns = [i for i in ["Not Hate", "Target: Disability"]])

# Plot the confusion matrix with larger labels
plt.figure(figsize=(20,14))
sn.heatmap(confusion_matrix, annot=True, cmap="YlGnBu", fmt='g', annot_kws={"size": 70})
plt.xlabel('Predicted', fontsize=70)
plt.ylabel('Actual', fontsize=70)
plt.title('Confusion Matrix: Disability (LRCV)', fontsize=80)
plt.xticks(fontsize=45)
plt.yticks(fontsize=45)
plt.show()
This is what we get (Pretty cool, right?):
Analyzing the Results
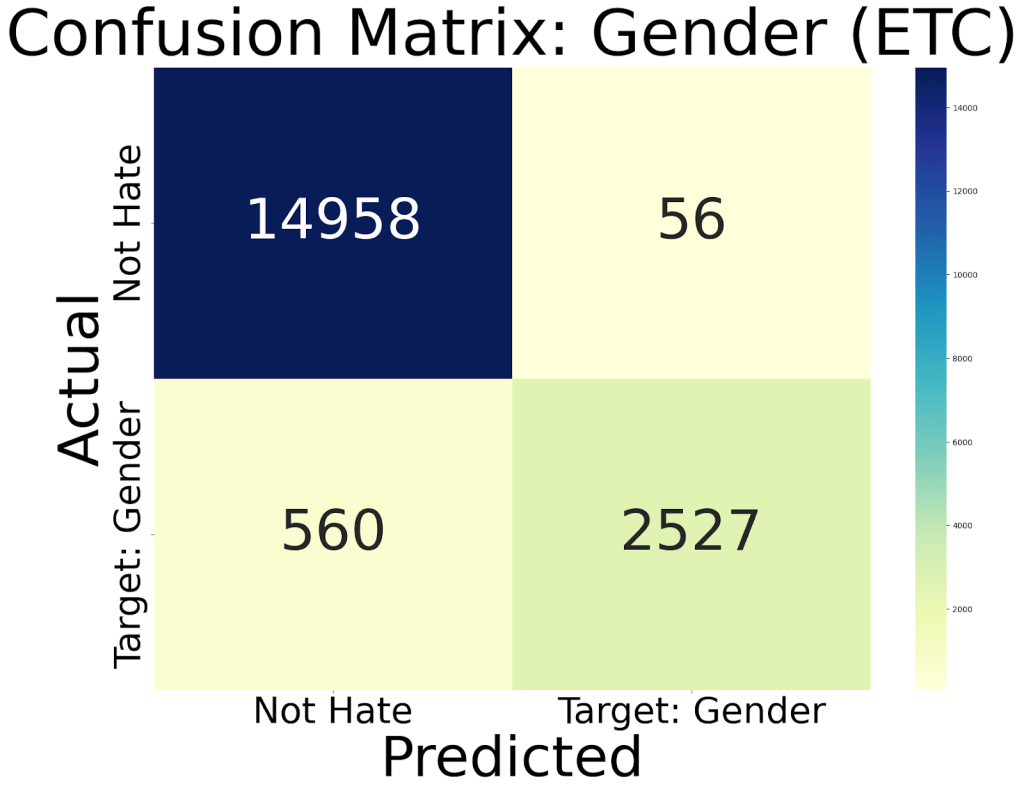
The confusion matrix allows us to visualize how well the model distinguishes between different categories of hate speech. For instance, a well-performing model will have high values along the diagonal of the matrix, representing correct classifications. Values off the diagonal indicate misclassifications.
And as can be seen on our poster, we can crown some winners (which I will reveal by pasting their Confusion Matrices and Target-Task below):


In this blog series, we successfully built and evaluated models to classify hate speech by the type of identifier it targets. Here’s a quick recap of what we’ve done:
- Data Preprocessing: Cleaned and prepared the dataset, splitting it into training and testing sets.
- Model Selection: Trained a wide range of machine learning models, including Logistic Regression, Random Forest, and Support Vector Machines.
- Evaluation: Assessed the models using key metrics like accuracy, precision, recall, and F1 scores, and visualized the results with confusion matrices.
Among the models tested, Logistic Regression with Cross-Validation (LRCV) stood out as the best classifier in the majority of tasks, consistently achieving accuracies well over 90%. However, it’s important to acknowledge that our dataset was highly imbalanced, meaning accuracy alone is not a reliable metric in this case. For more imbalanced datasets, F1 scores and Recall are better indicators of model performance.
Even with those metrics, LRCV still performed quite well, handling the imbalance effectively and yielding strong results in terms of recall and F1 scores. This suggests that LRCV is a robust choice for classifying hate speech by targeted identifiers, although further fine-tuning and data balancing techniques could enhance performance even more.
